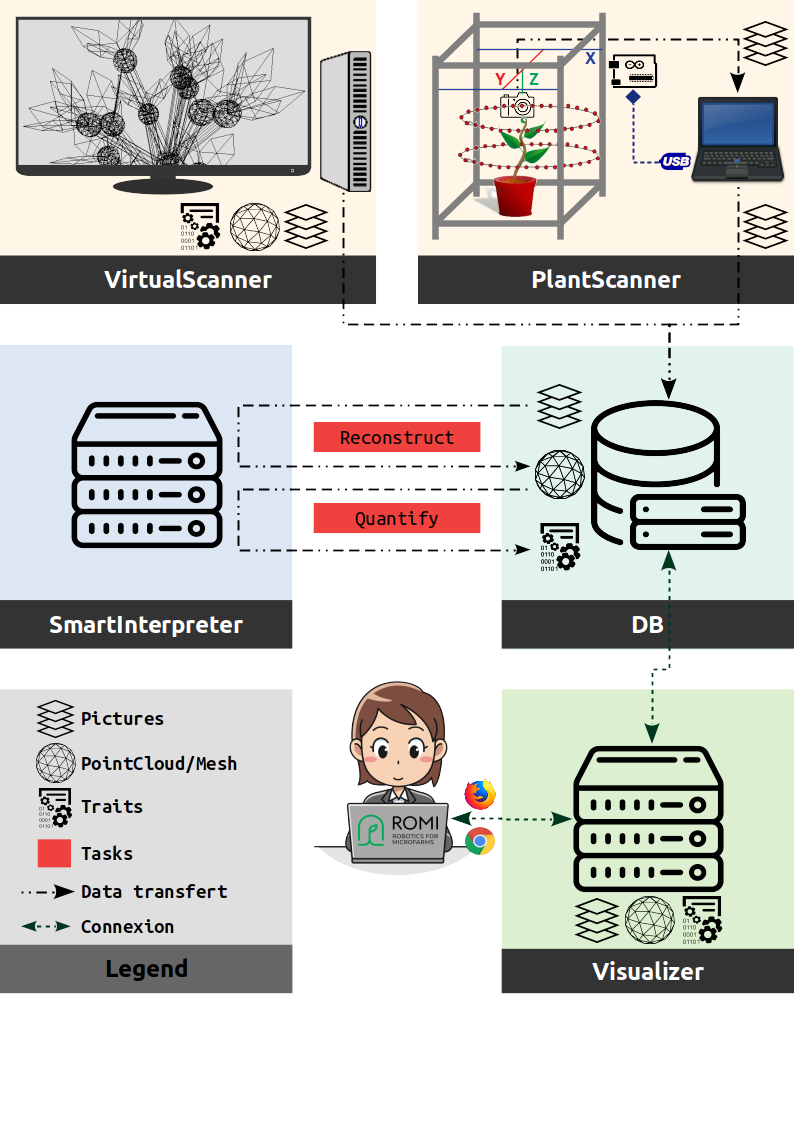
Hereafter we illustrate the different components of the plant scanner and their interactions.
User story:
- The user put his/her plant inside the scanner and run acquisitions, which returns a set of images per plant.
- These images are uploaded to a central database.
- The user defines a pipeline to reconstruct and quantify plants architecture by choosing among a set of predefined methods and algorithms. These instructions may be run by a distant server.
- Finally the user can access the acquisitions, reconstructions & quantitative data by connecting to a visualization server using his/her computer